Heatmap
Upload a gene expression file (support csv,txt,xls,xlsx)
Upload a sample metadata file (support csv,txt,xls,xlsx, optional)
Help Center
Help Center
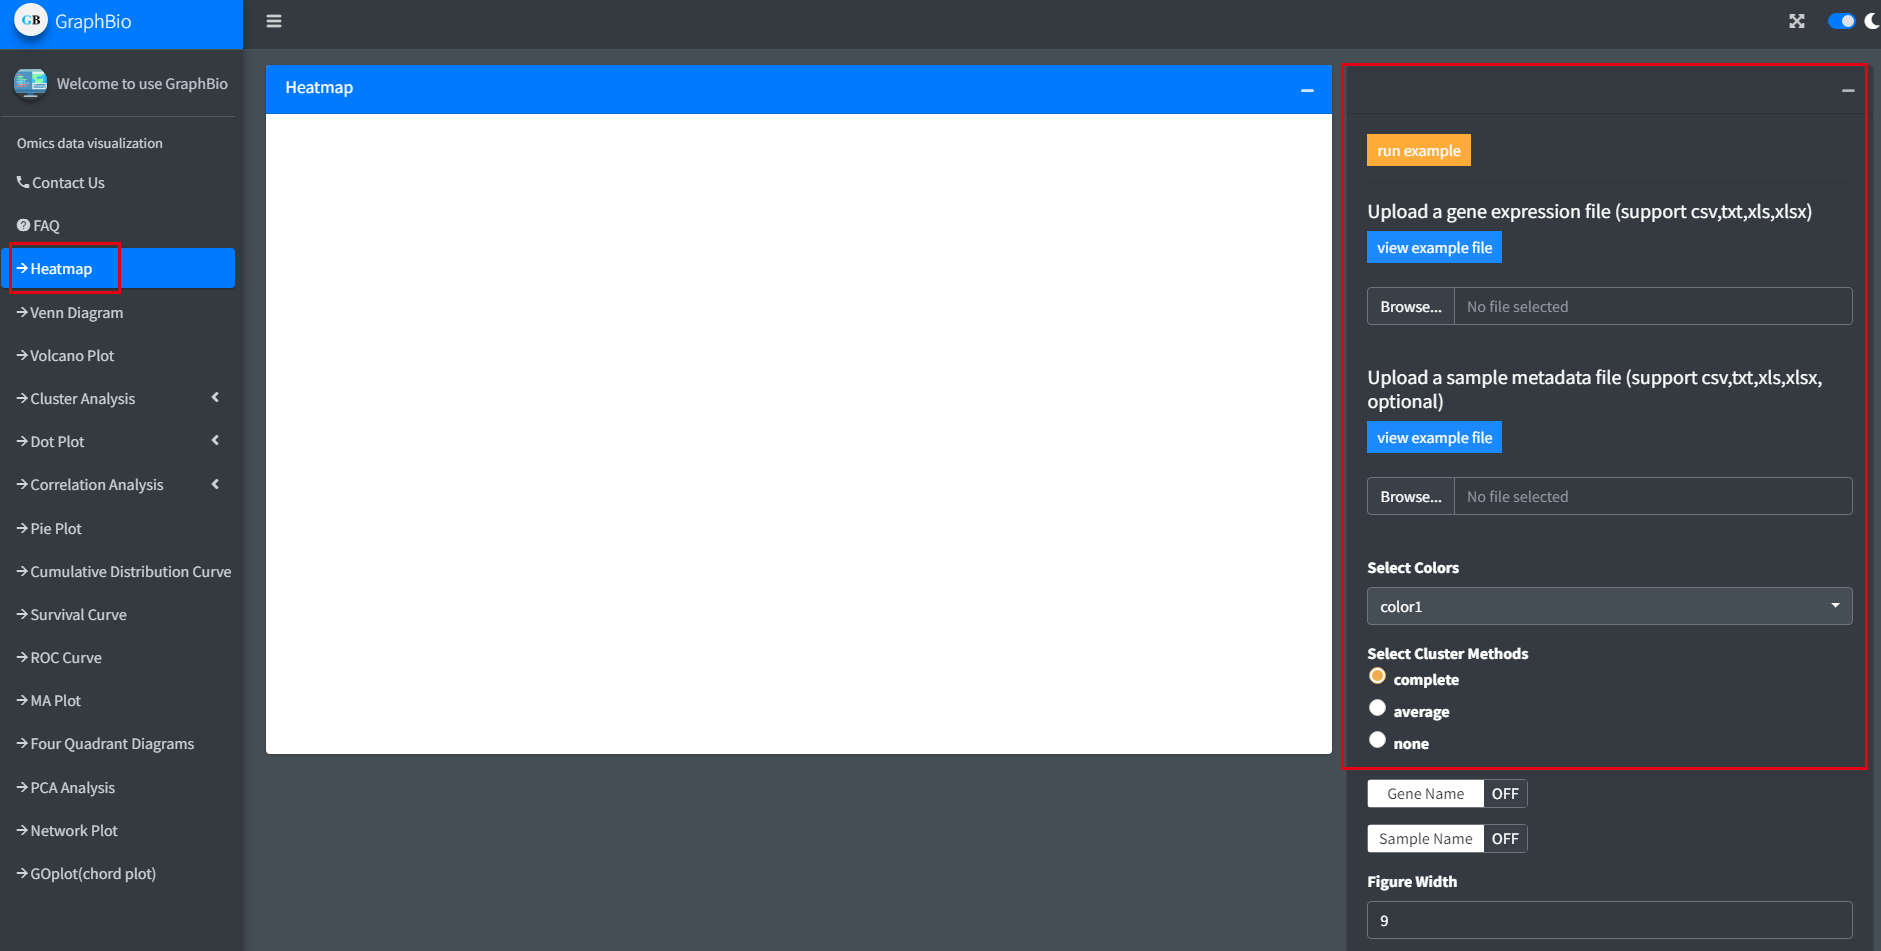
GraphBio includes various of popular data visualization function modules for omics data, and each module follows same design priciple so as to let users use easily. GraphBio supports mutiple common inputfile formats including csv,txt(tab-separated),xls,xlsx, and mutiple common figure formats including pdf,png,jpeg,tiff can be easily downloaded. Here, let's take heatmap as an example to demonstrate the abilities of GraphBio. First of all, we need to click <heatmap> module on the left panel of GraphBio.Then we can see a parameters settings panel on the right of GraphBio.
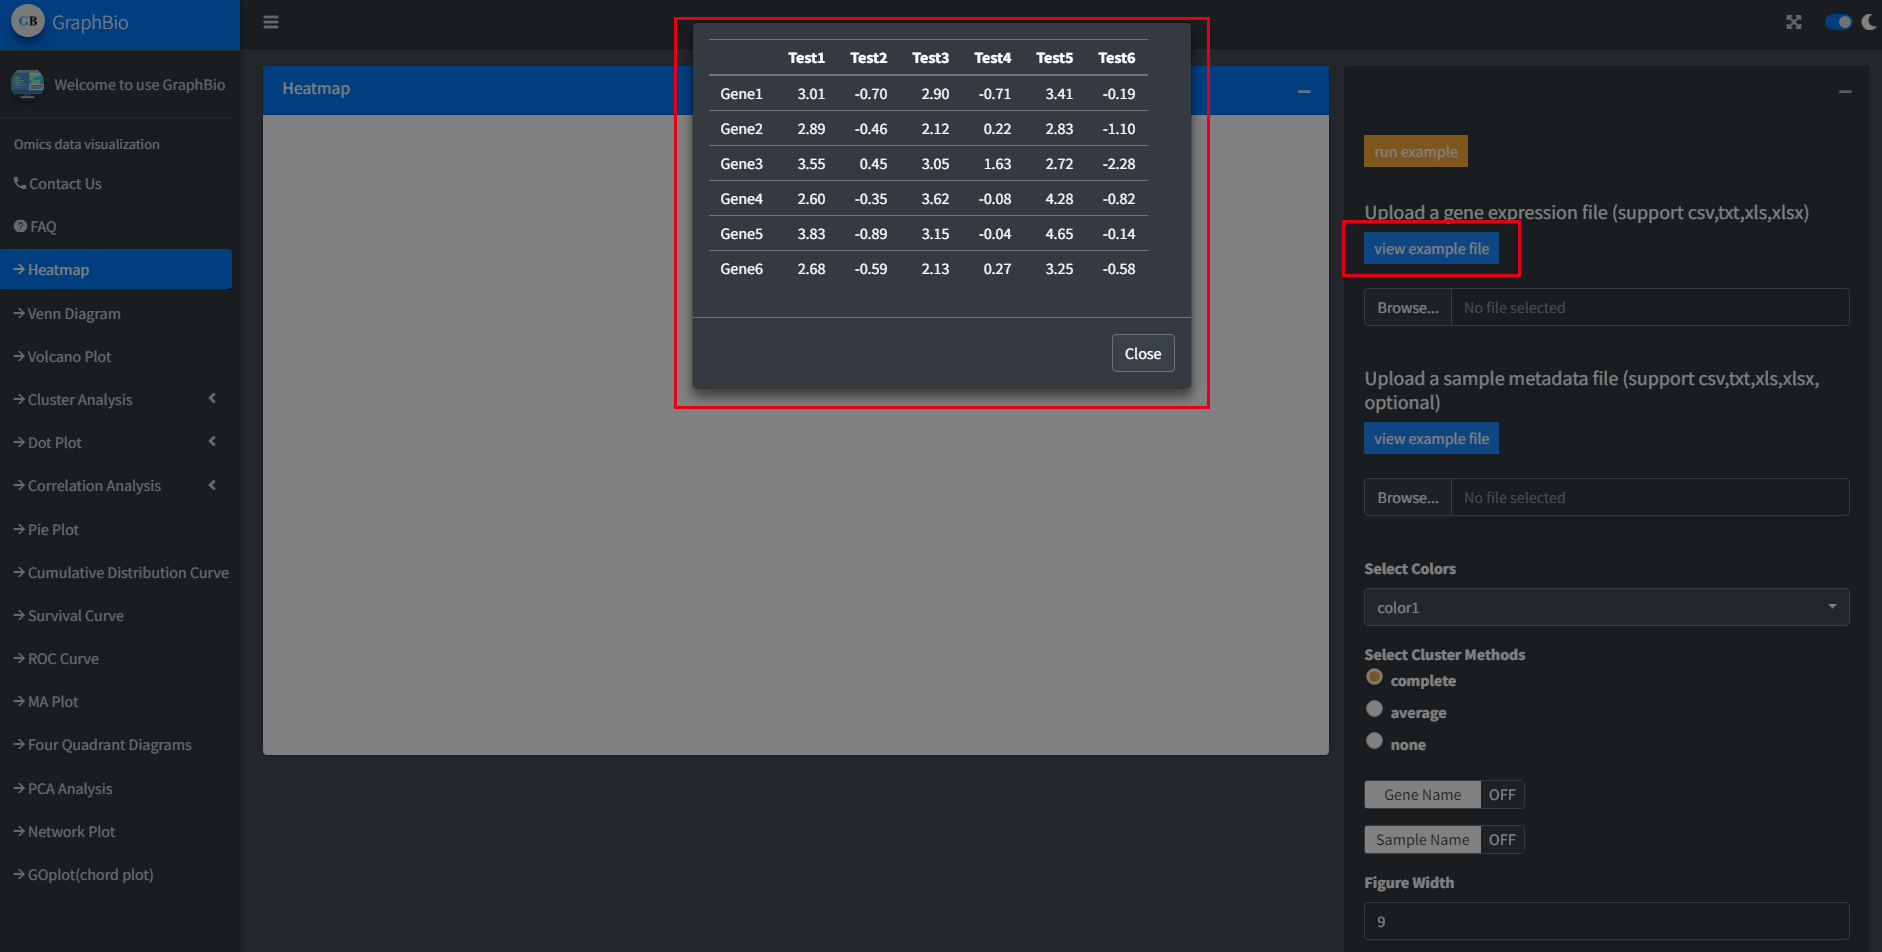
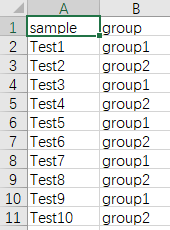
Before upload a file, we need to click <view example file> button and view content style.
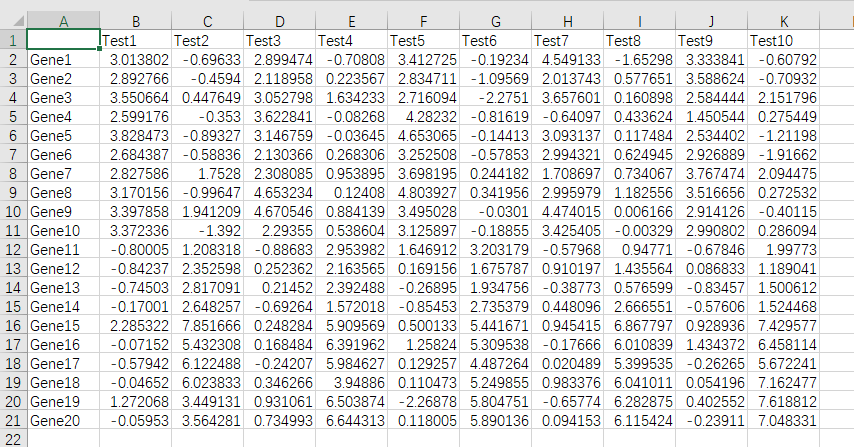
Subsequently,we can prepare our own file via Excel software according to reference example file. The prepared file can be saved as one of four formats(csv,txt,xls,xlsx).
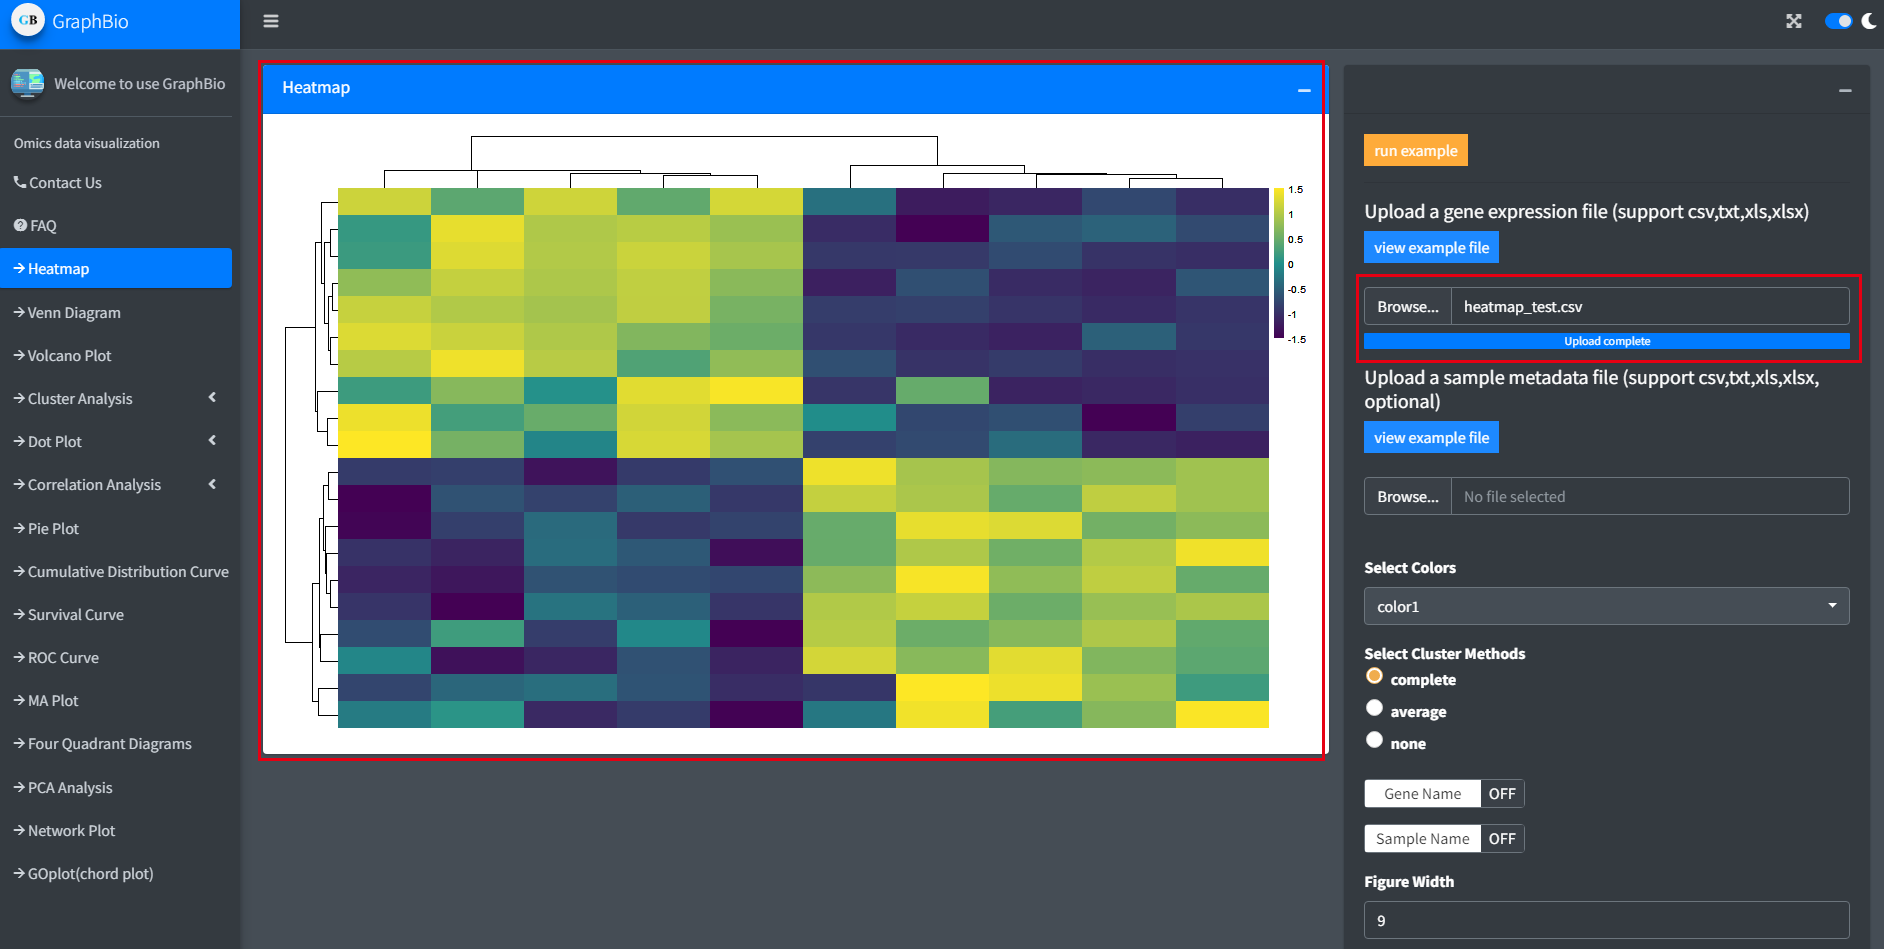
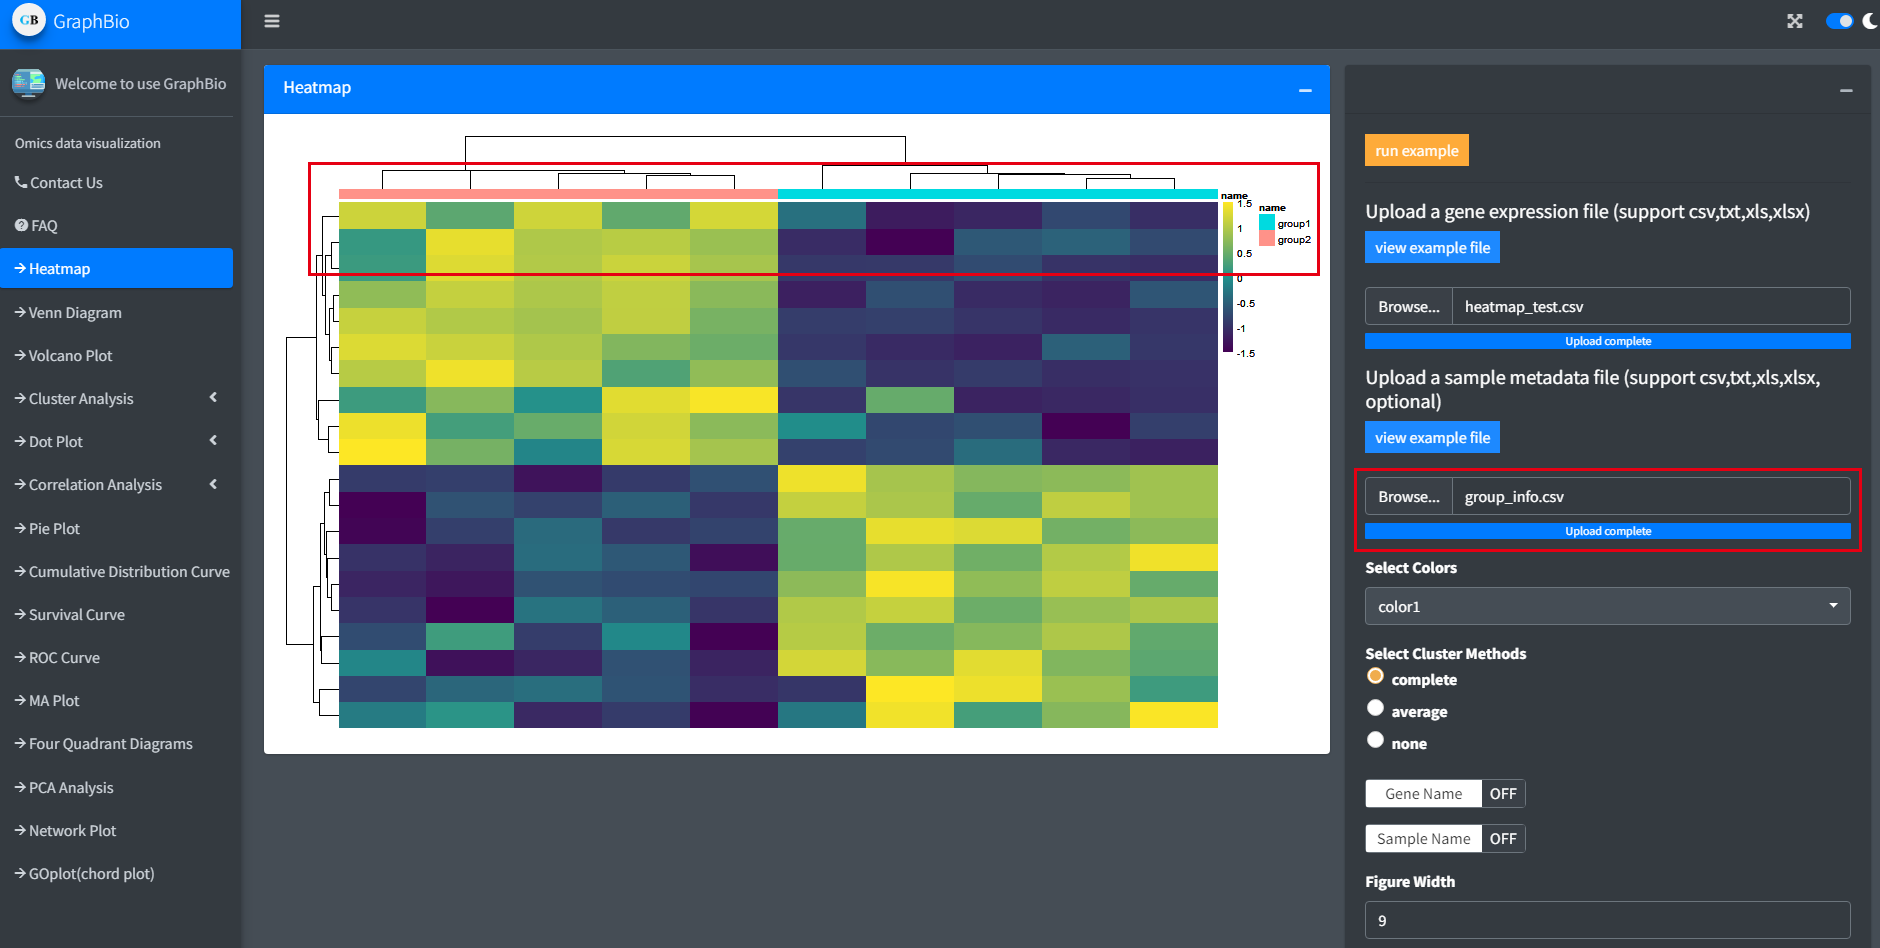
Then upload the file by clicking <Browse...> button. When the upload flow is complete, the figure is automaticly made.
Usually, we possiably want to add a group annotation bar on the figure.Thus, we can upload another sample metadata file.
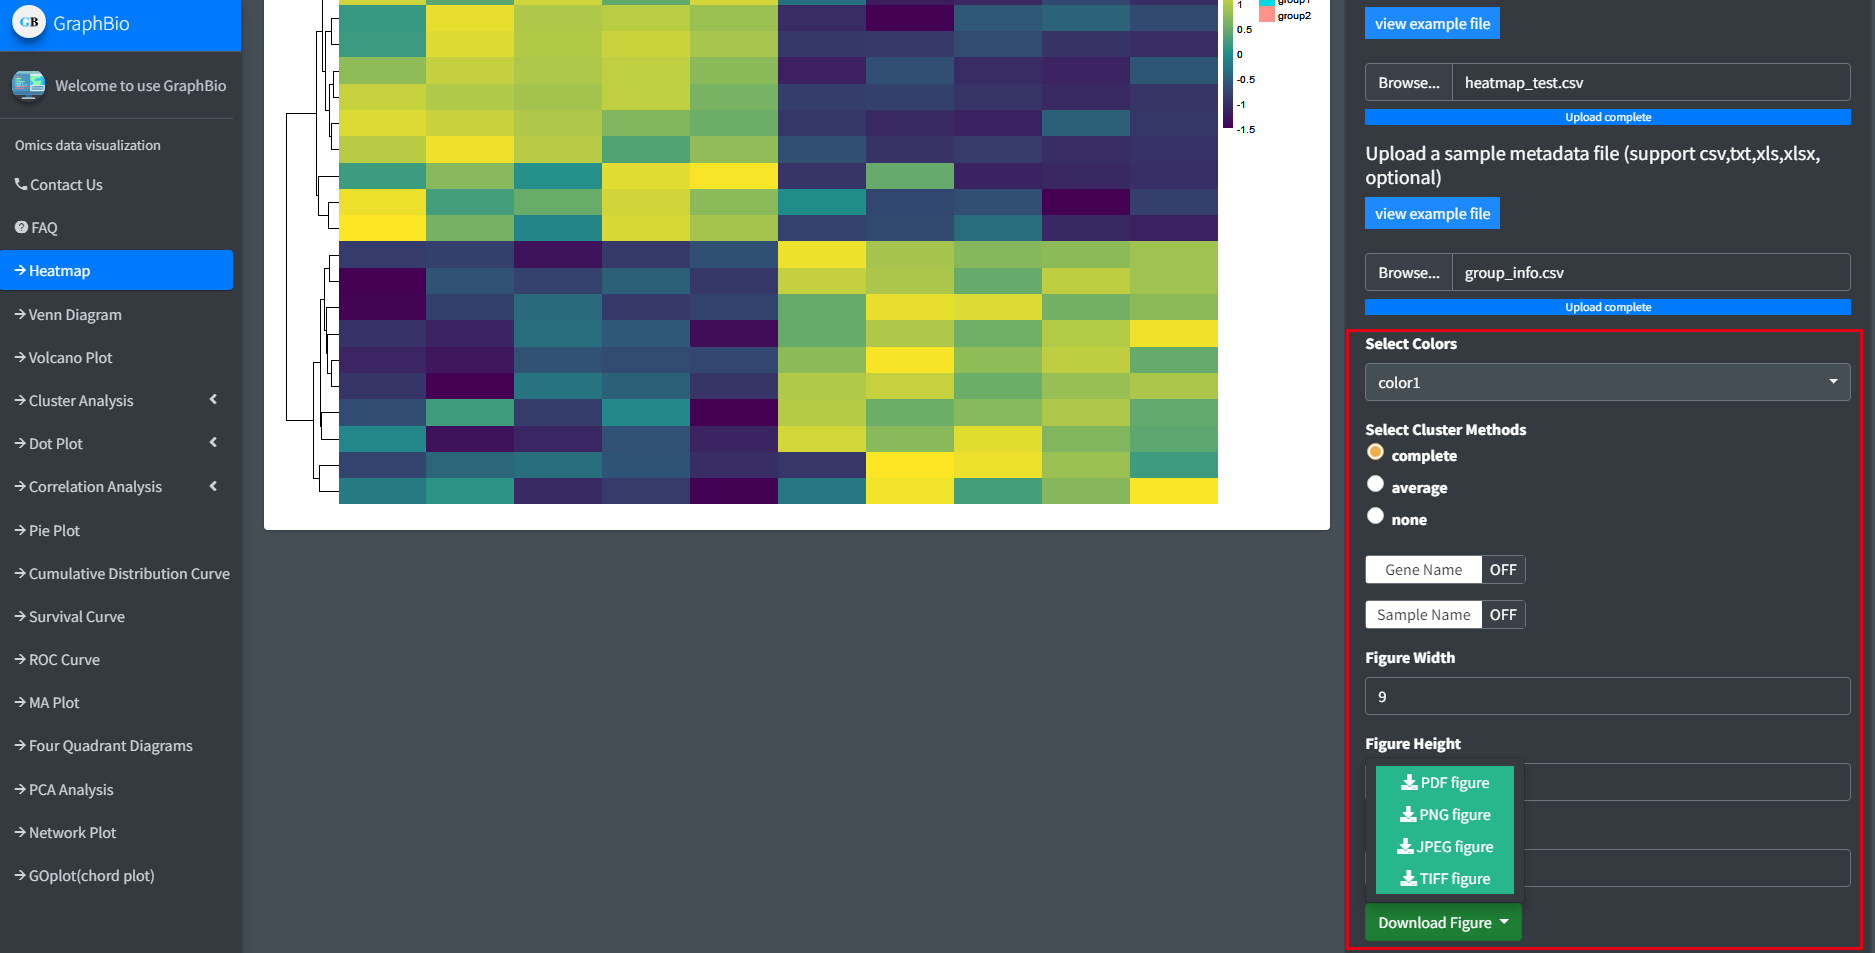
Moreover,we provided mutiple popular color presets selections and other necessary cutomization settings,users can freely test these settings.Finally,we prodvied mutiple popular figure formats for users to download.
Contact Us
GraphBio is a easy-to-use visualization analysis tool for omics data. It provides 15 popular visualization analysis modules, including heatmap, volcano plots, MA plots, network plots, dot plots, chord plots, pie plots, four quadrant diagrams, venn diagrams, cumulative distribution curves, PCA, survival analysis, ROC analysis, correlation analysis and text cluster analysis. This enables experimental biologists without programming skills to easily perform visualization analysis and get publication-ready plots in shorter time.In the future, we will continue to integrate popular visualization analysis methods into GraphBio, and provide more easy-to-use modules to research community, accelerating the pace of scientific research in cloud era.
If you have any problem while using GraphBio, pleast feel free to contact us (databio@163.com), or attach the file and ask us in github (https://github.com/databio2022/GraphBio). The latter is recommended.
FAQ
FAQ
1. Citation: Zhao T and Wang Z (2022), GraphBio: A shiny web app to easily perform popular visualization analysis for omics data. Front. Genet. 13:957317.doi: 10.3389/fgene.2022.957317
2. GraphBio limits file uploads to 5MB per file.
3. When we save file as csv format in Mircosoft Excel,please do not select csv UTF-8 format. Meanwhile, the content should not contain commas.
4. The file to be uploaded should not contain NaN values.
5. When clicking [view example file] button, example file only show part data for demonstrating the format of input file.The completed demo data have been reposited in github (https://github.com/databio2022/GraphBio)
6. The downloaded PDF figures can be easily edited using Adobe Illustrator or Adobe Acrobat software.
7. Volcano plot data should not be filtered based on statistical signifcance, it also should contain other non-significant data.
8. When you meet warning(Error,An error has occured. Check your logs or contact the app author for clarification), this usua1ly means that your prepared data have some problems, such as duplicated rownames, NaN values, weird characters et al. If you can not find problems by yourself, please attach the file and ask us in github (https://github.com/databio2022/GraphBio).
9. Four Quadrant Diagrams require that data are distributed on four quadrant. When you upload a file and error occured, you can adjust fold changes to zeros in right parameters settings panel. If it is not helpful, it means that your data is not distributed in four quadrant.
10. First column of file should not be duplicated.